Airborne
minefield detection
SIC activity
This page describes the work performed by SIC.
Contribution
SIC is responsible for individual sensor data processing and
data fusion. Some geo-coding has also been performed.
Methodology
We concentrated our effort on the development of tools to accelerate
the work of photo interpreters by finding region of interest. For that,
SIC's graphical interface has been enhanced so that a user can easily navigate
through the image and take the final decision.
During phase I, we decided not to use any contextual information, mainly
because this information may not be relevant in a real case. We therefore
selected mine indicators and built some algorithms to detect them. Since
where mines are laid some vegetation anomalies can be seen, we focused
on the detection of "easy-to-find" characteristics, typically using the
spectral response of a mine laid on the ground.
At the end of phase I, photo interpreters gained an experience that
we decided to use. We are now working on new algorithms based on methods
used by photo interpreters during phase I. This will help reducing the
false alarm rate.
Images used
A near infrared scanned image from MK2000 camera provided by Aerodata
and covering minefield C.
A colour scanned image from Leica camera provided by Eurosense and covering
the neighbourhood of minefield C.
A colour infrared scanned image from Leica camera provided by Eurosense
and covering the immediate neighbourhood of minefield C.
After the Belgium tests some additional images were available:
-
Radar (X and P band) : around 30 images provided by Aerosensing
Not geo-coded and difficult to geo-code by SIC
low resolution for X-band
-
Thermal infrared: about 25 images provided by Recon Opticals
Not geo-coded and difficult to geo-code by SIC
-
Digital colour: 7 images at the time from Vos80 camera provided by EOS
not geo-coded and difficult to geo-code by SIC
huge distortion
The quality of the images acquired before the Belgium test is far better.
Therefore they were used for automatic analysis.
Graphical user interface
The images were visually inspected to find features characteristic
of mines. Because the available images are huge, not registered and coming
from different sensors at different resolutions, it was necessary to enhance
our graphical user interface to allow an efficient navigation through the
available image database. Using new tools, most of the images were geo-referenced,
and put together into a virtual image called MIF (multiple image format).
The position of the known mines was encoded together with their attributes.
All this allows for an easy navigation trough the known mines. For a recorded
mine of interest the user may request the available attributes, such as
type or depth, as well as the available image channels. It is then possible
to go from an available channel to another or to display all channels simultaneously
in a common projection.
Building a mine (indicator) model
To develop any tool for semi-automatic mine detection, a model of a
mine, or a mine indicator, is needed since all such tools encode a model
either explicitly or implicitly. The expertise of photo interpreters is
very useful to build these models. The model presented here was designed
by SIC without any input from photo interpreters.
Some vegetation anomalies (missing vegetation for instance) can be
seen where mines are laid. Unfortunately, a huge amount of such regions
exists and to reach a reasonable false alarm rate, complementary mine characteristics
(specific patterns, signature in different spectral bands, etc.) have to
be introduced in the model. Therefore, in a first approach the typical
spectral response (Visible and near infra-red) of an AT mines lying on
the ground was used.
Algorithms for mine detection
Two algorithms have been implemented for mine detection.
The first algorithm is based on a maximum detection followed by a region
growing in the blue band. The growing algorithm uses a rough model of the
mine to compute a local contrast that is then used to derive the growing
stop criteria.
The second algorithm, written by Vinciane
Lacroix, is based on a threshold in the blue band to find regions of
interests. Afterwards, edges are computed in those regions and grouped.
Finally, the shape of the region is considered and the candidate is kept
if it is sufficiently circular and has an appropriate radius.
Detection of partially occluded circles
As explained above, the shape of the candidate regions may be used as
discriminant feature. Mines lying on the ground present circular shapes.
However, the mine is often partially occluded and we developed an algorithm
that is able to recognize circular shapes even if they are partially occluded.
A measure of the circularity is returned together with an estimation of
the radius. The radius provides a better estimation of the size of the
object than the visible area (partial occlusion) and is thus more discriminant.
The algorithm estimates a circle that goes through most of the
pixels of a given list. This is useful when it is known that the pixels
should lie along a part of a circle but some of them can be wrong and very
far from the circle.
Several triplets of pixels are selected in the list and the circles
defined by these three pixels are computed. For each circle, the distances
of all the pixels of the lists to this circle and the percentiles of these
distances are computed. The circle selected is the one giving the smallest
percentiles of errors. The number of triplets is computed so that the probability
to have at least one triplet without erroneous pixel, and thus a correct
circle, is higher than 0.99.
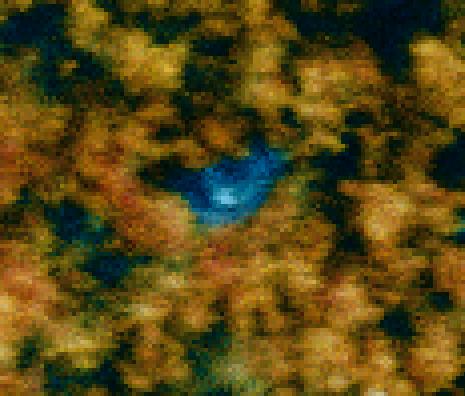
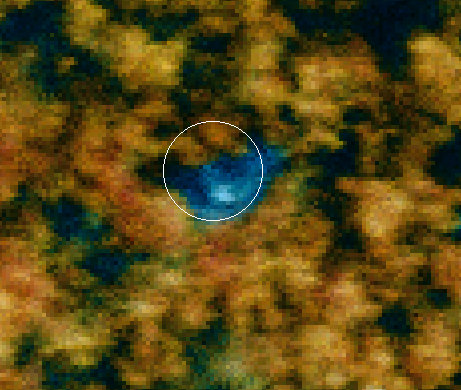
Close-up of an anti-tank mine in colour infrared. Only a part of the
mine is visible. The blue colour is due to the fact that the colour green
is seen blue in colour infrared.
Contour of the mine detected. Because of the occluded part, the shape
is not circular.
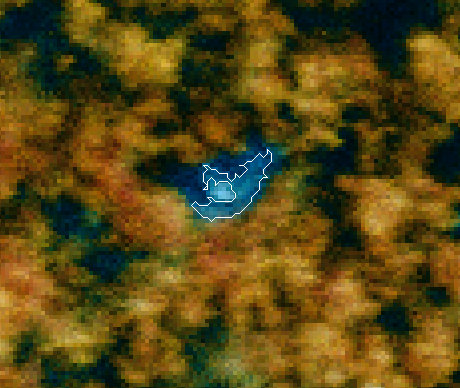
Circle estimated from the previous contour. It is a good approximation
of the position and size of the mine. If an absolute co-ordinate system
is available, it is possible to have an approximation of the real size
of the mine and then an indication of which type of mine we are dealing
with.
Evaluation
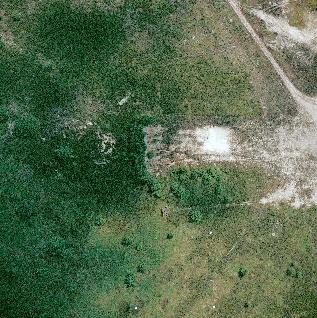
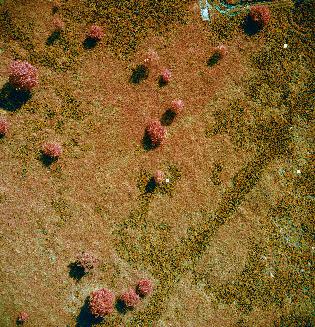
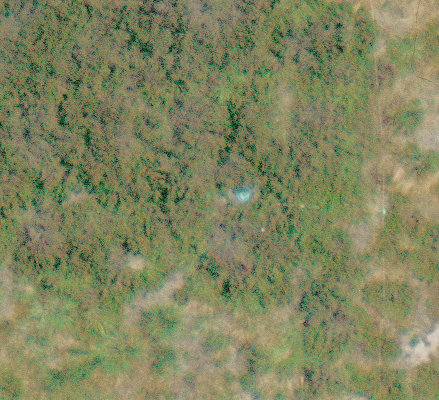
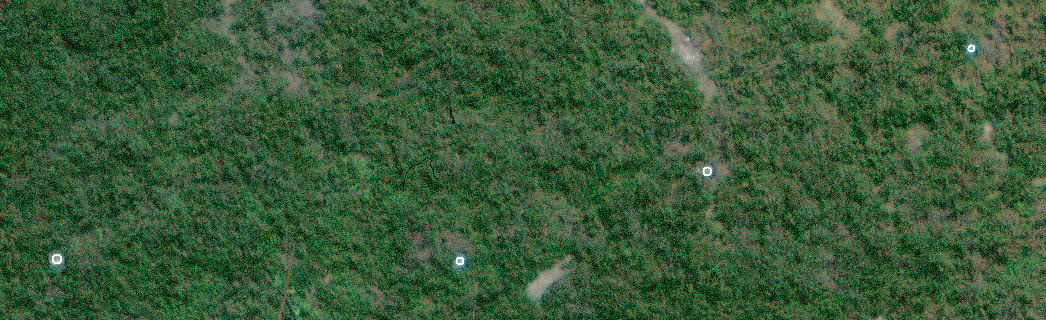
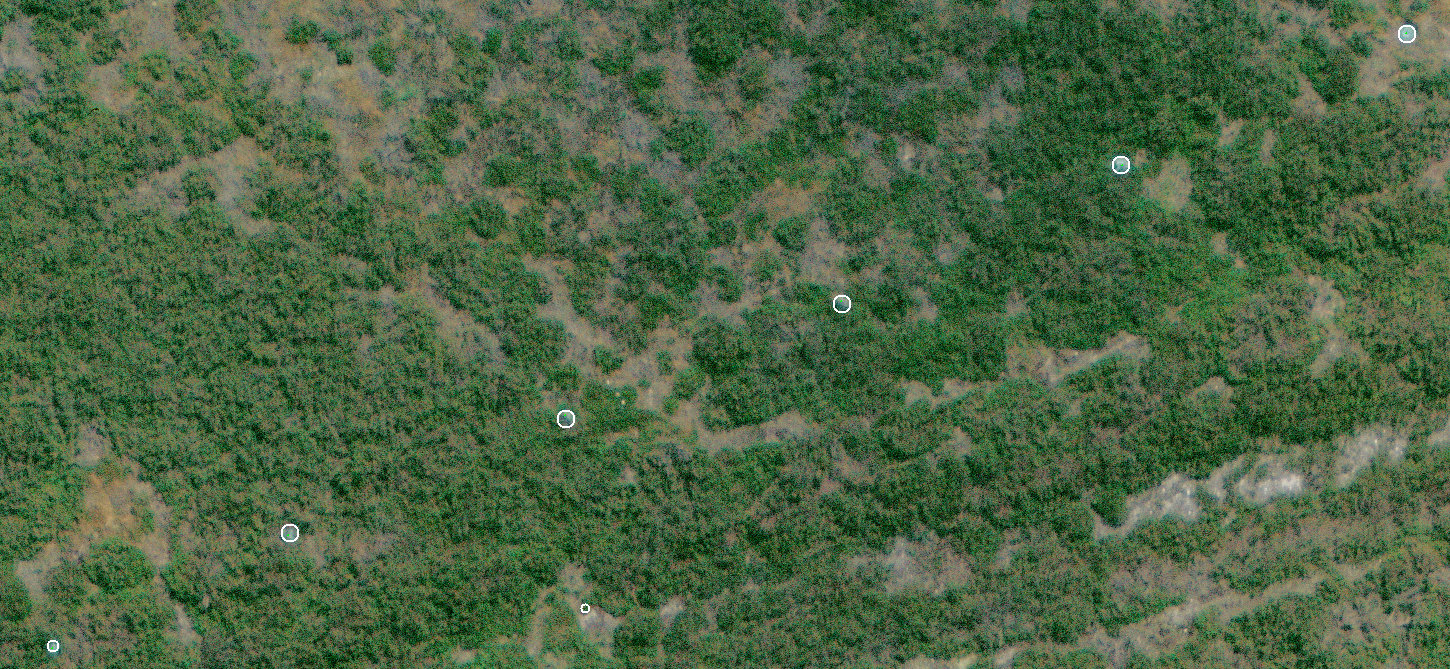
The following images present the result of the automatic mine detection
on the full visible and colour infrared images.
On the visible image, a V-shaped minefield has been detected. Note that
no mines of minefield C has been found. The anti-tank mine 281 (anti-tank
mine lying on the ground and clearly visible) was first detected but rejected
by the attribute based filter. Using a better filter criterion, it could
be possible to keep that mine without increasing the false alarm rate but
little effort was spent for this fine-tuning because we believe that an
algorithm that learns from example should be used in practice. This could
not be tested until now because the database contains too few examples
of known and detected mines. In this context a learning scheme would probably
lead to poor results (over-training = learning by heart rules that are
only valid for the training set and that may not be extrapolated to new
data).
On the colour infrared image representing minefield C at a higher resolution
but with only a small neighbouring region (the V-shaped minefield is not
in the imaged region), three anti-tank mines (on and below the surface)
of minefield C have been detected. Note that for the buried anti-tank mines,
it is a stick lying near the mine that is detected. Even if the stick may
be considered as a valid mine indicator, they were found by chance because
the algorithm was not developed to find such objects. We concentrated our
efforts on the detection of indicators that could be helpful in real cases.
If it appears that such sticks are good indicators, a better detector will
be developed. Note that the size of the visible image is about 400 MB and
that this image covers a region of about 500 square metres. The full image
was processed in about 30 minutes on a Pentium Pro (200 MHz, 64 MB RAM)
running under Linux. The position of known mines has been superimposed
on both images (dots are known mines and crosses are mines proposed by
the algorithm).
Conclusions
The tool was developed to find anti-tank mines lying on the ground.
Most of those mines were detected and the false alarm rate is reasonable.
Even two buried mines were found because a stick left in the vicinity of
the mines was detected. We believe that the false alarm rate could be reduced
in the near future by some simple improvements. As an example many false
alarms in the colour infrared are found in the trees. A tree detection
algorithm could reduce the false alarm rate significantly.
Of course, if image processing is only able to detect anti-tank
mines lying on the ground, its usefulness in real situation would be quite
limited. However, if photo interpreters are able to detect more minefields
using other mine indicators, image processing could be helpful to detect
those indicators leading to a substantial acceleration of the data analysis.
Although limited, the results of the first evaluation presented here
have shown that significant process acceleration can be reached by means
of image processing. By removing the false alarms found in the trees of
the colour infrared image, the found alarms could be grouped in about 10
regions of interest. If the photo interpreter takes 30 seconds to look
at each region, 5 minutes would be needed to analyse the scene. Whereas
a full visual inspection was carried out at full resolution, the photo
interpreters would typically spend at least one minute for a region of
1,000 on 1,000 pixels. 150 such regions have to be analysed for a full
coverage of the colour infrared image leading to about 2 hours of interpretation.
A process acceleration of about 60 may thus be expected. Such a speedup
would be very useful in an operational context where the amount of data
to be analysed would be tremendous. Without image processing and with the
same assumptions as above, 650 man-hours would be needed for a complete
visual inspection of a scene of 10 square kilometres.
For comments or questions contact: Pascal
Druyts or Yann Yvinec.